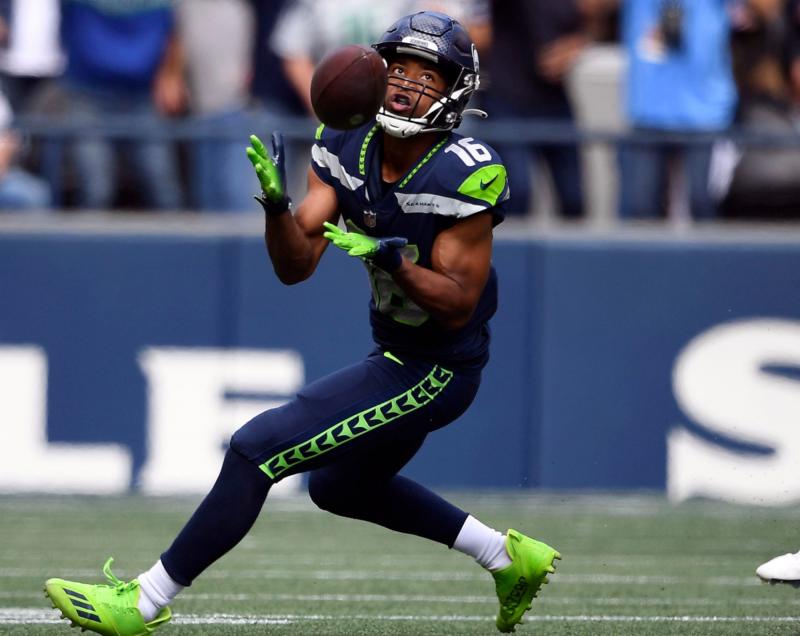
Earlier this year we did a series called “Jock Talk”, which looked at ways to improve a prospective Jocker’s MLB strategy. With NFL season right around the corner, lets dive into NFL data from 2021 for some tips and tricks for the upcoming season.
Last week we looked at when short selling is a profitable strategy, this week we’re going to dig into volatility. Which players are the most volatile in cash markets and when can we use this to our advantage?
Volatility + Standard Deviation
First, let’s define volatility in a metric that we can measure. In Jock MKT, before each game a player has a projected fantasy point value which helps the market determine their IPO price (fantasy_points_projected in the dataset). At the end of the market, the amount of fantasy points the player actually scores (fantasy_points_scored) determines where they rank in the market and thus their final payout.
To determine how much a player over or under performs their projections, we can subtract a players actual points from their projected points (fantasy_points_scored – fantasy_points_projected) to get their points difference. IE; if a player was projected to score 5 points but scored 10, their points difference would be 5. If they were projected to score 5 but scored 0, their points difference would be -5.
To measure volatility we can look at the amount of variation/dispersion between a players points differences. Put another way, was a player very consistent (they scored very close to their projected amounts) or were they more unpredictable (scoring vast amounts over, or under, their projected amount). This metric is called standard deviation.
Average ROI vs Standard Deviation of NFL Players by Position

What Stands out?
All position groups show a positive correlation between standard deviation of points difference and ROI. Let’s use this information to help us find profitable players. Ideally, we want to target players who have high volatility, high average ROI and low risk. To help identify these players I broke down two of the above position groups, Wide Receivers and Tight Ends, by IPO price and volatility.
Wide Receivers + Tight Ends to Target


As IPO price decreases, the correlation between standard deviation and average ROI increases. A player like Russell Gage is a perfect example of a great player to target with this low risk/high reward trait. Gage finished with 0 fantasy points three times last season while also doubling his projected fantasy point total three times. If you invested in Gage in his 6 most volatile games last year what would the results have been?
In the three markets where he finished with 0 fantasy points, Gage IPO’d at $3.00, $2.70 and $2.75. Since the minimum payout in Jock MKT is $1, if you bought 1 share of Gage each market he would have paid out $1 on each of those occasions making your losses ($1-$3) + ($1-$2.70) + ($1-$2.75) = -$5.45.
What about the three markets where he significantly outperformed expectation? In those markets, Gage IPO’d at $3.46, $3.79 and $3.01 and paid out at $25, $8.00 and $13.00. Given these figures, if you bought one share of Gage during these markets your total profit during these three markets would be ($25.00-$3.46) + ($8.00-$3.79) + ($13.00-$3.01) = $34.74.
Despite 3 markets where Gage scored a total of 0 fantasy points, you would have profited $29.29 over these six markets with an ROI over 56%. His low price/high volatility combination is one you can count on to make money.
A player like Tyler Lockett highlights just how important IPO price is to your bottom line. In 13 markets where Lockett has IPO’d for a price between $4 and $7, he was one of the most successful receivers in that group, with an average ROI of 66%. However, in the 11 markets where Lockett IPO’d for a price > $7, his success fell dramatically. Lockett lost investors an average of 42% during those markets.
Conclusions
Volatility is an important weapon to use in your arsenal when deciding which players to target. By targeting players with a low IPO price and the ability to score a large amount of fantasy points more than projected is another example of how you can maximize your profits while minimizing your risk!
Article Specific + 2021 NFL Data!
Looking to do some analysis of your own? We have all the data from this article right here and the data for ALL of last year right here, so get busy because NFL season can’t get here soon enough!


